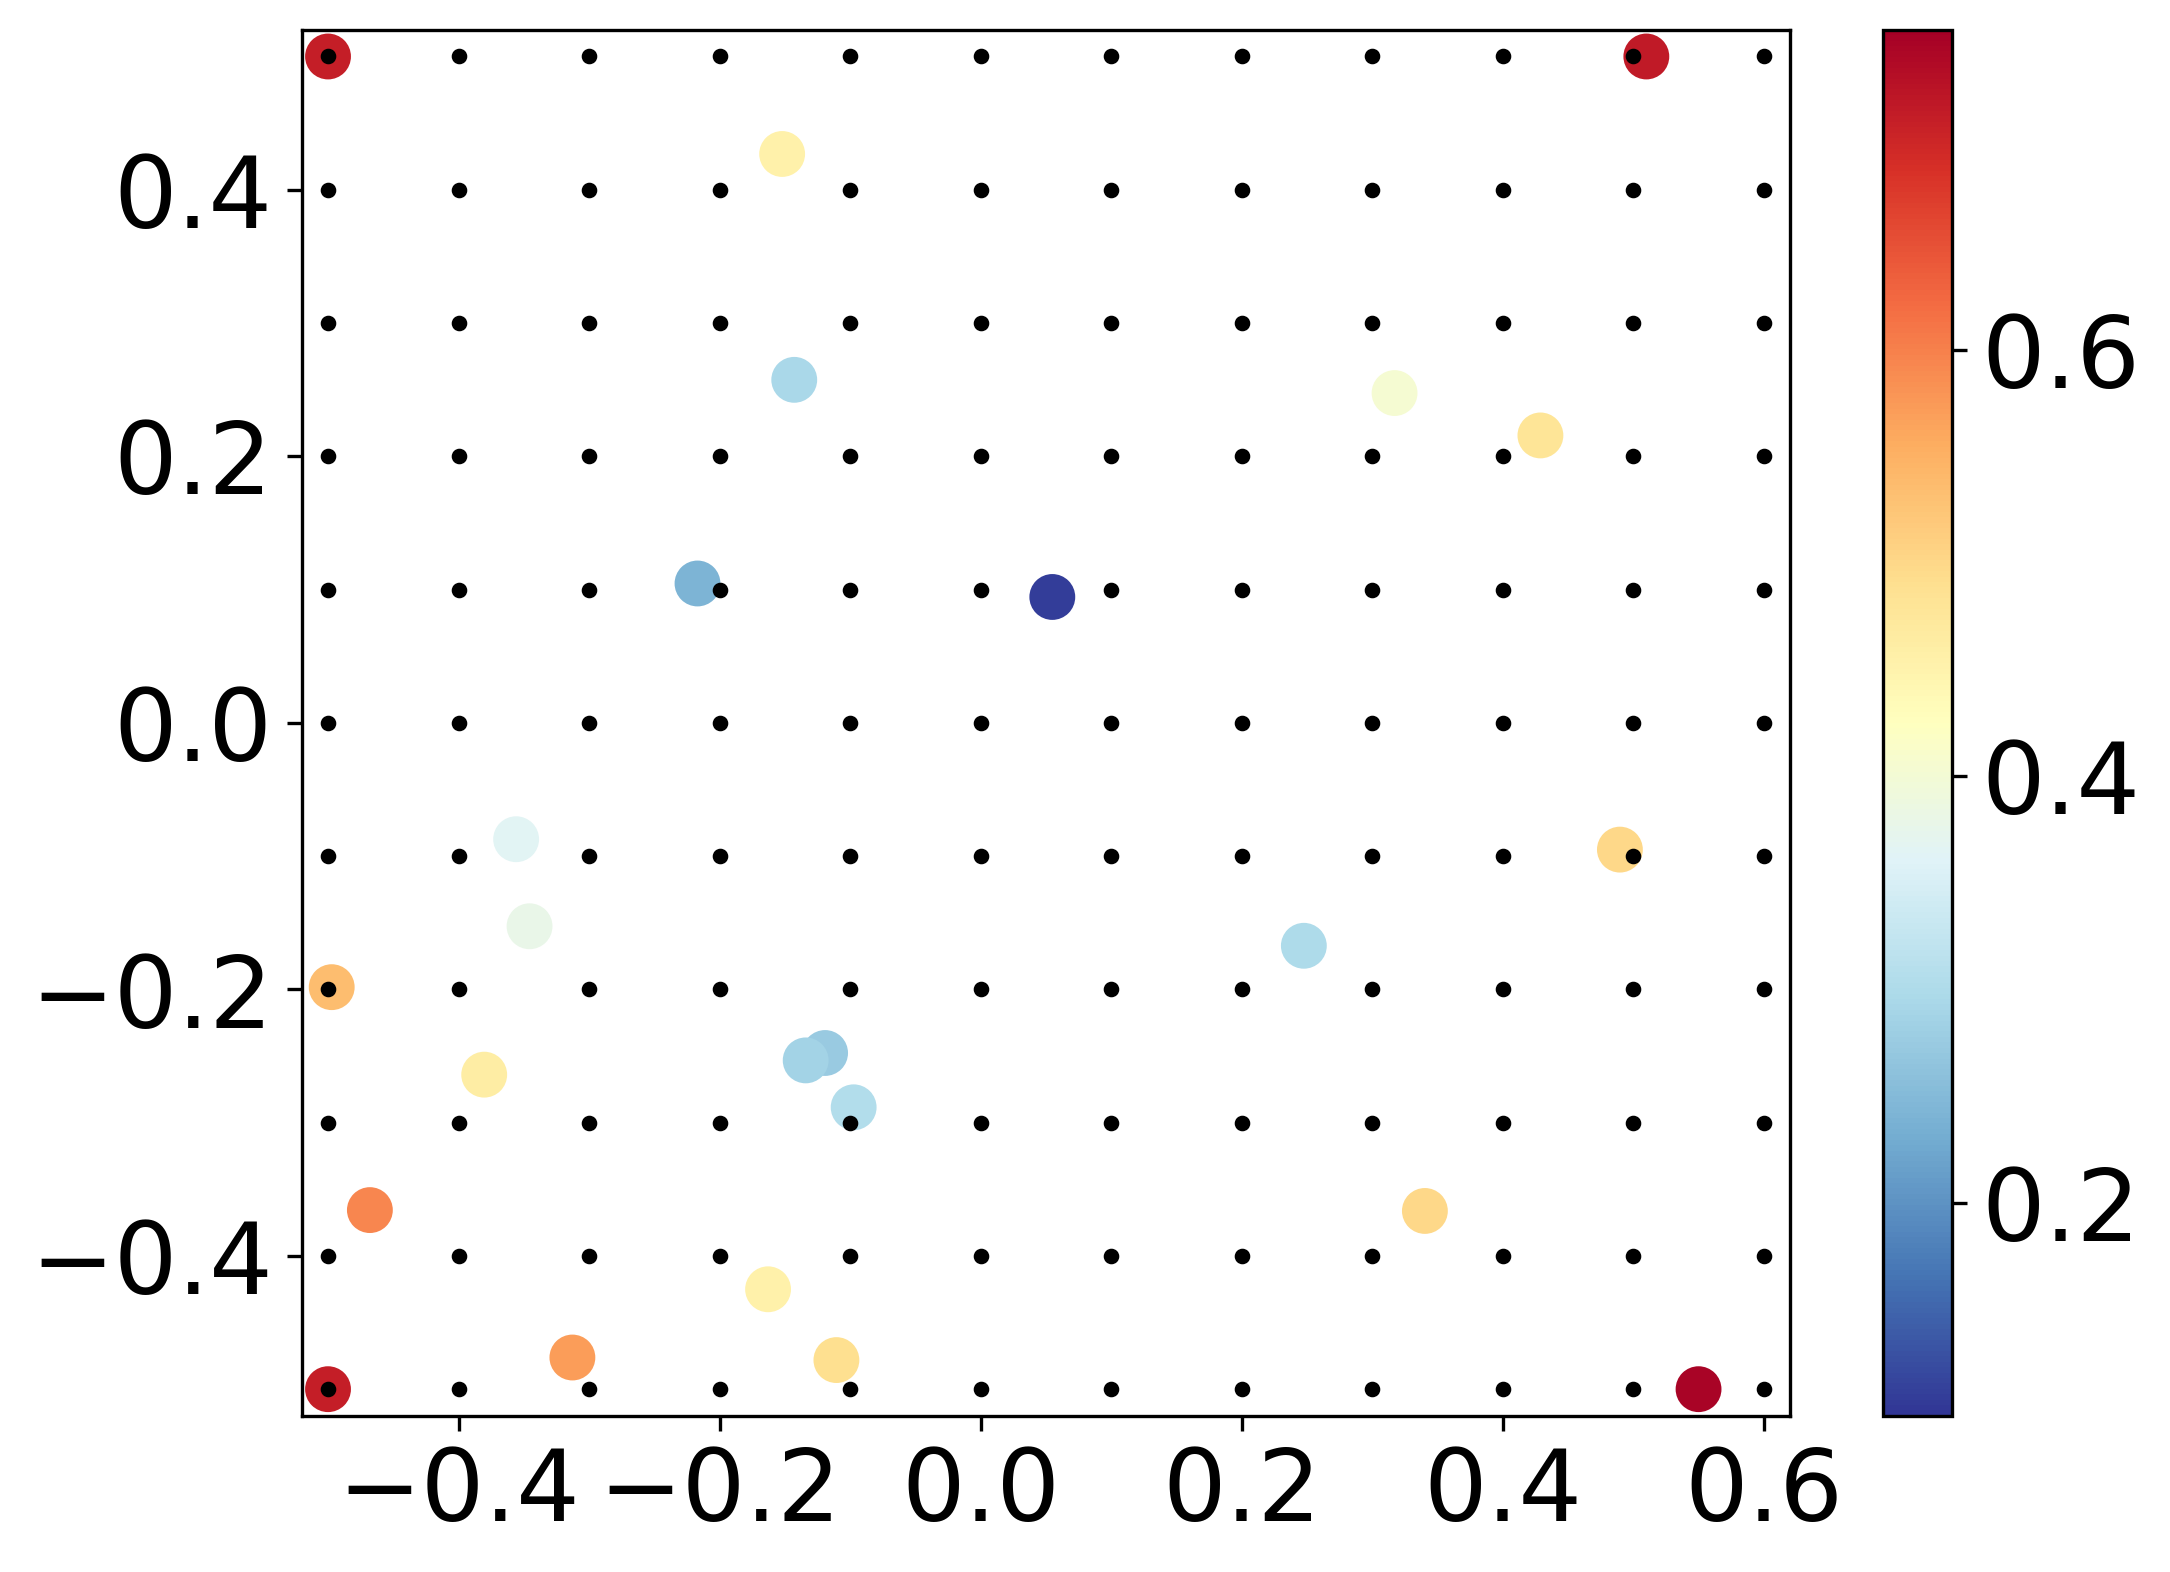
The DFT calculations are performed at discrete points in composition-strain space. The discrete DFT calculated bandgaps are then interpolated to create the final images. We used Clough-Tocher piecewise cubic, C1 smooth, curvature-minimizing 2D interpolant (griddata, CloughTocher2DInterpolator). The interpolated grid image was then smoothen using bilinear interpolation (note: in the paper we used bicubic. unfortunately, at the moment Bokeh does not support bicubic interpolation in regrid). The interpolation scheme follows:
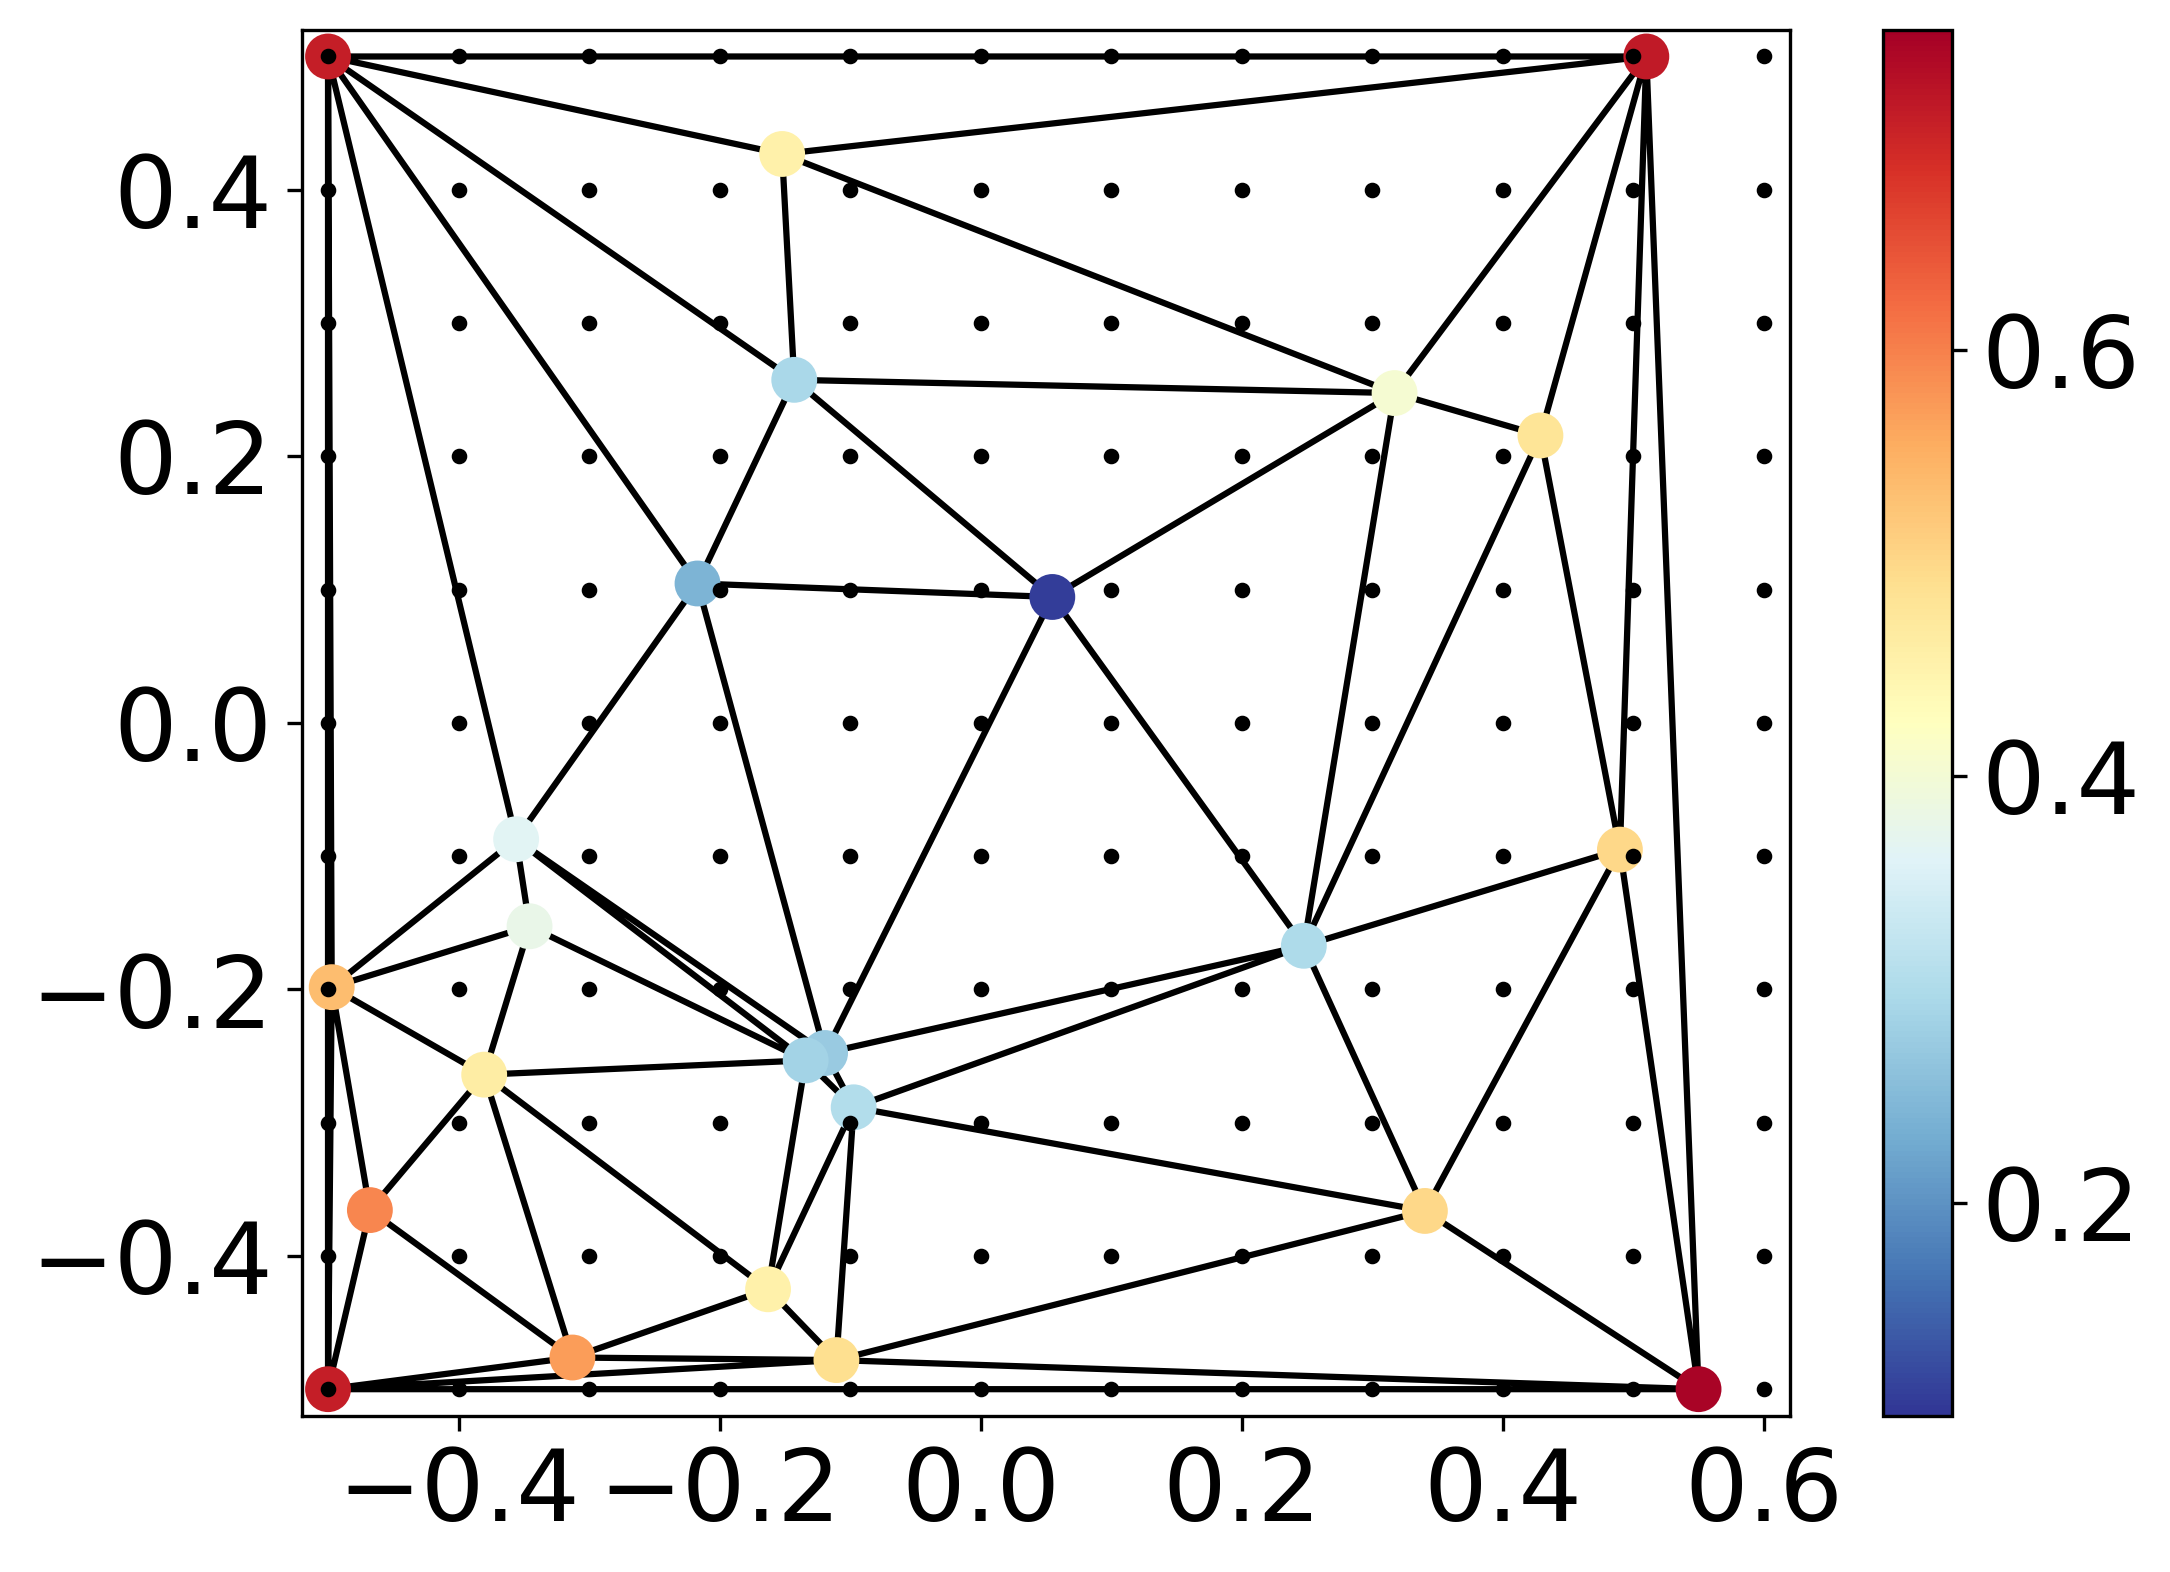
- The input points are first triangulated with Qhull (Delaunay triangulation).--> Figure 2
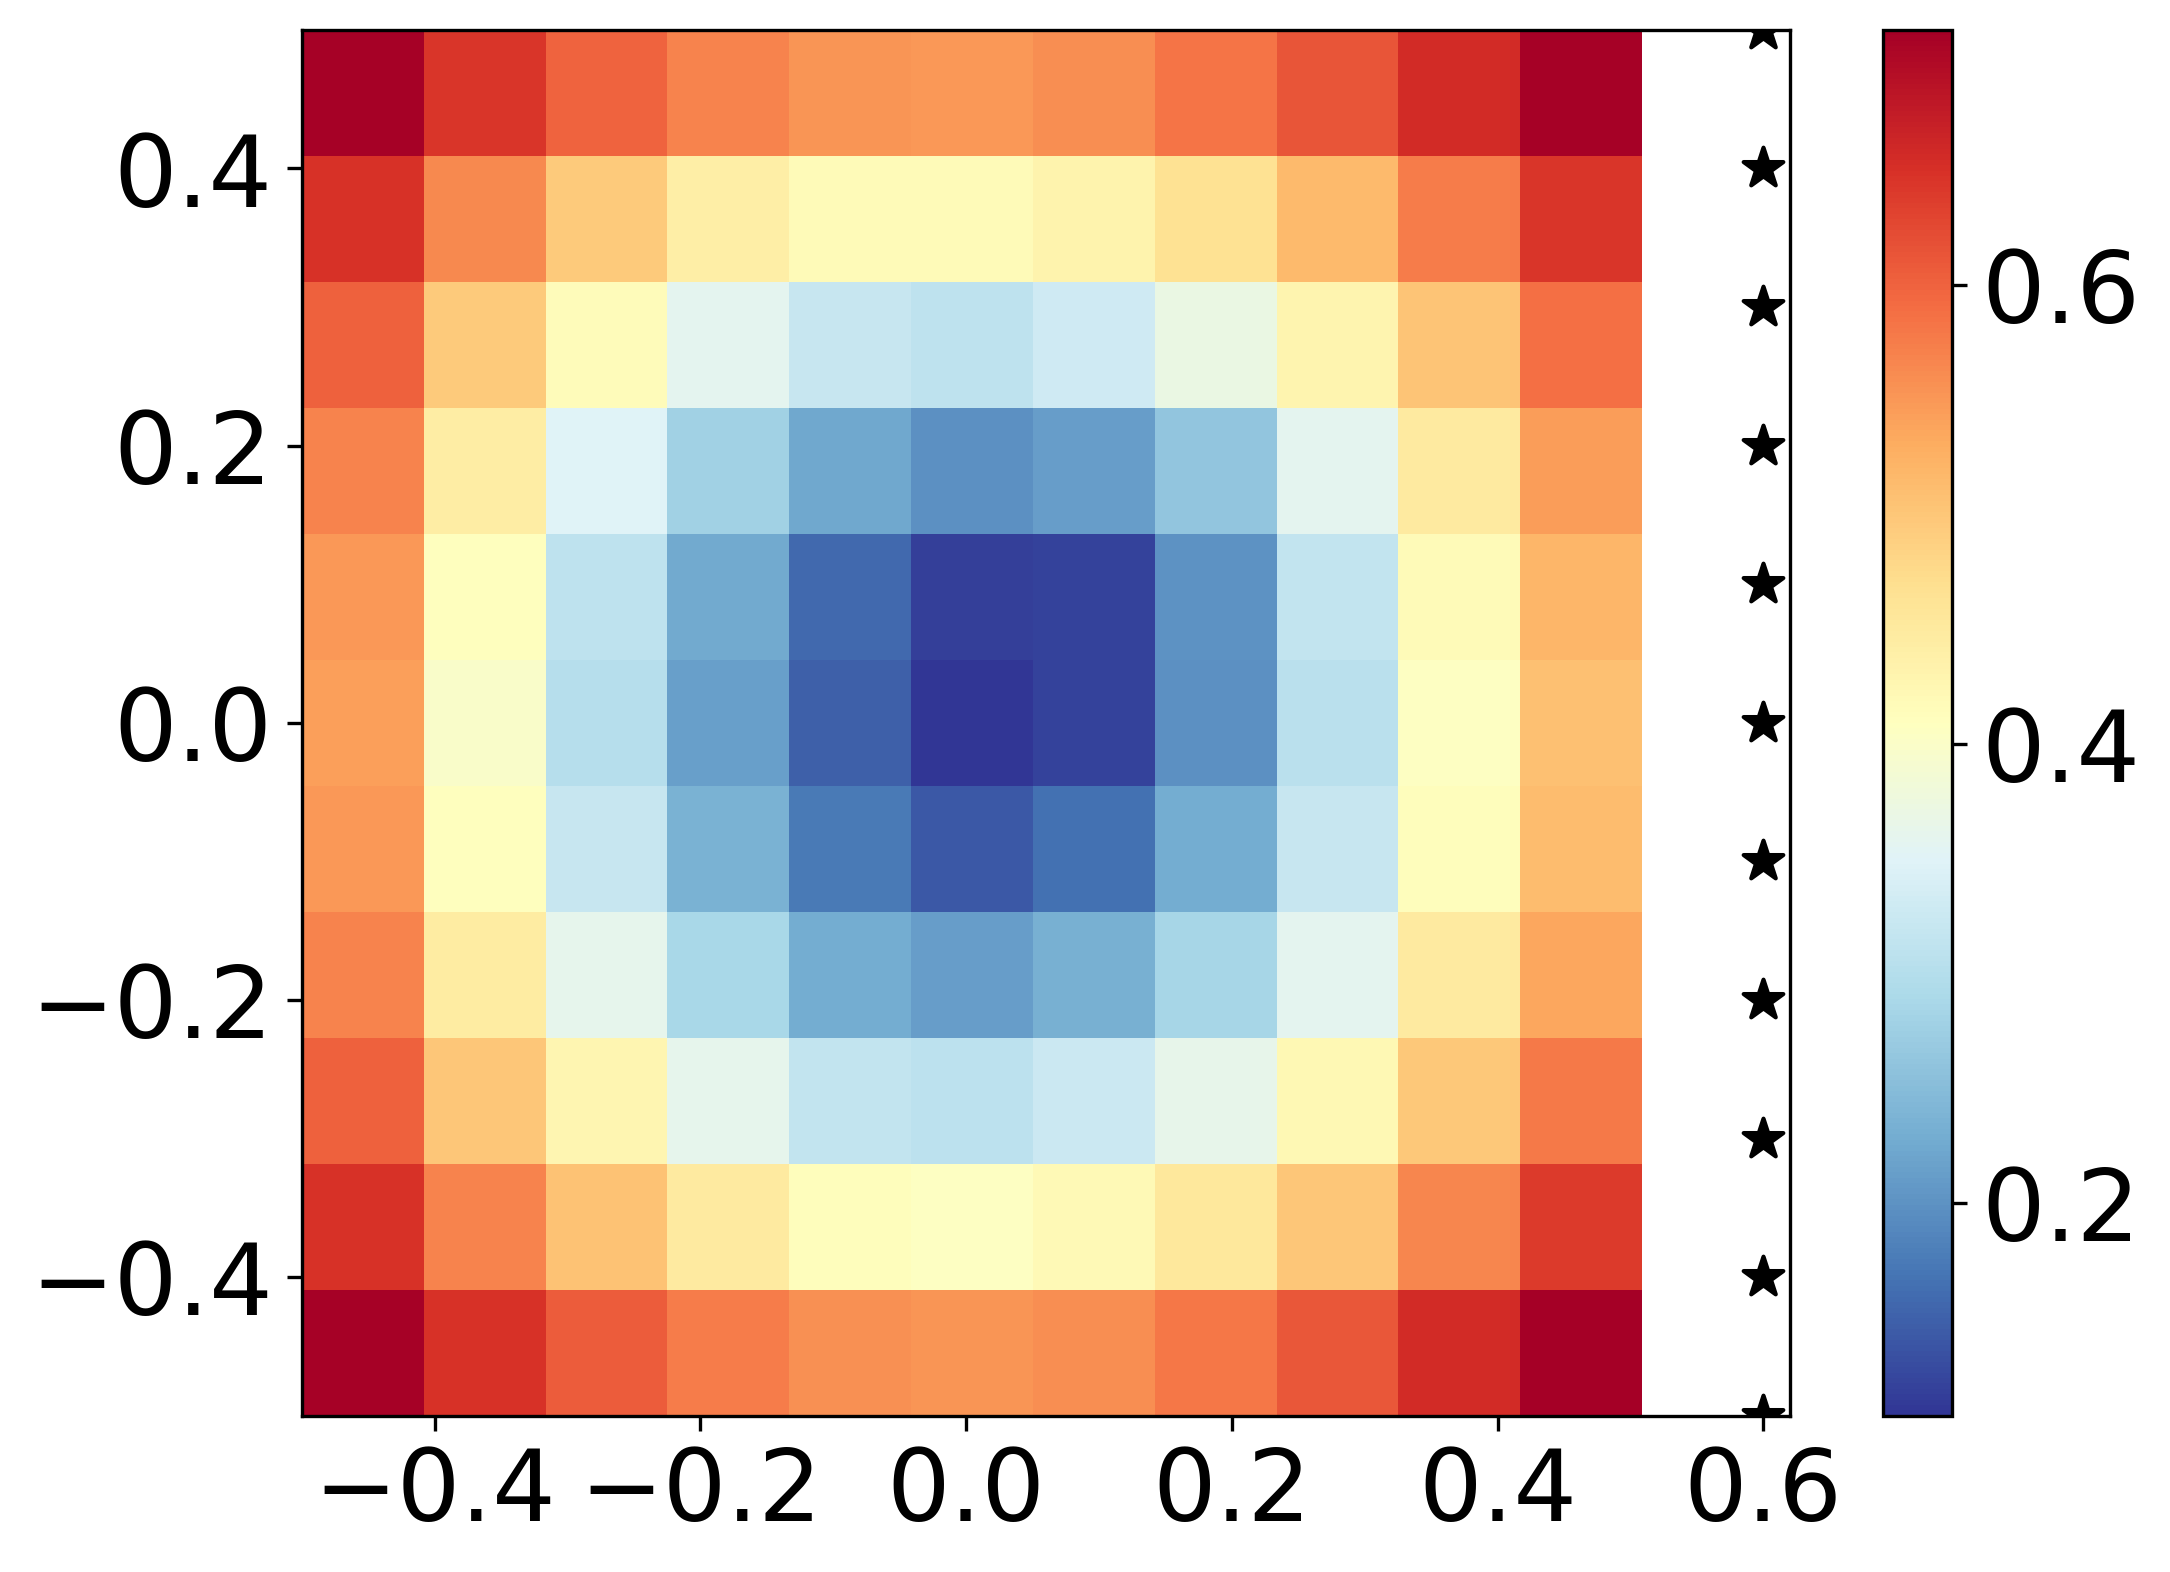
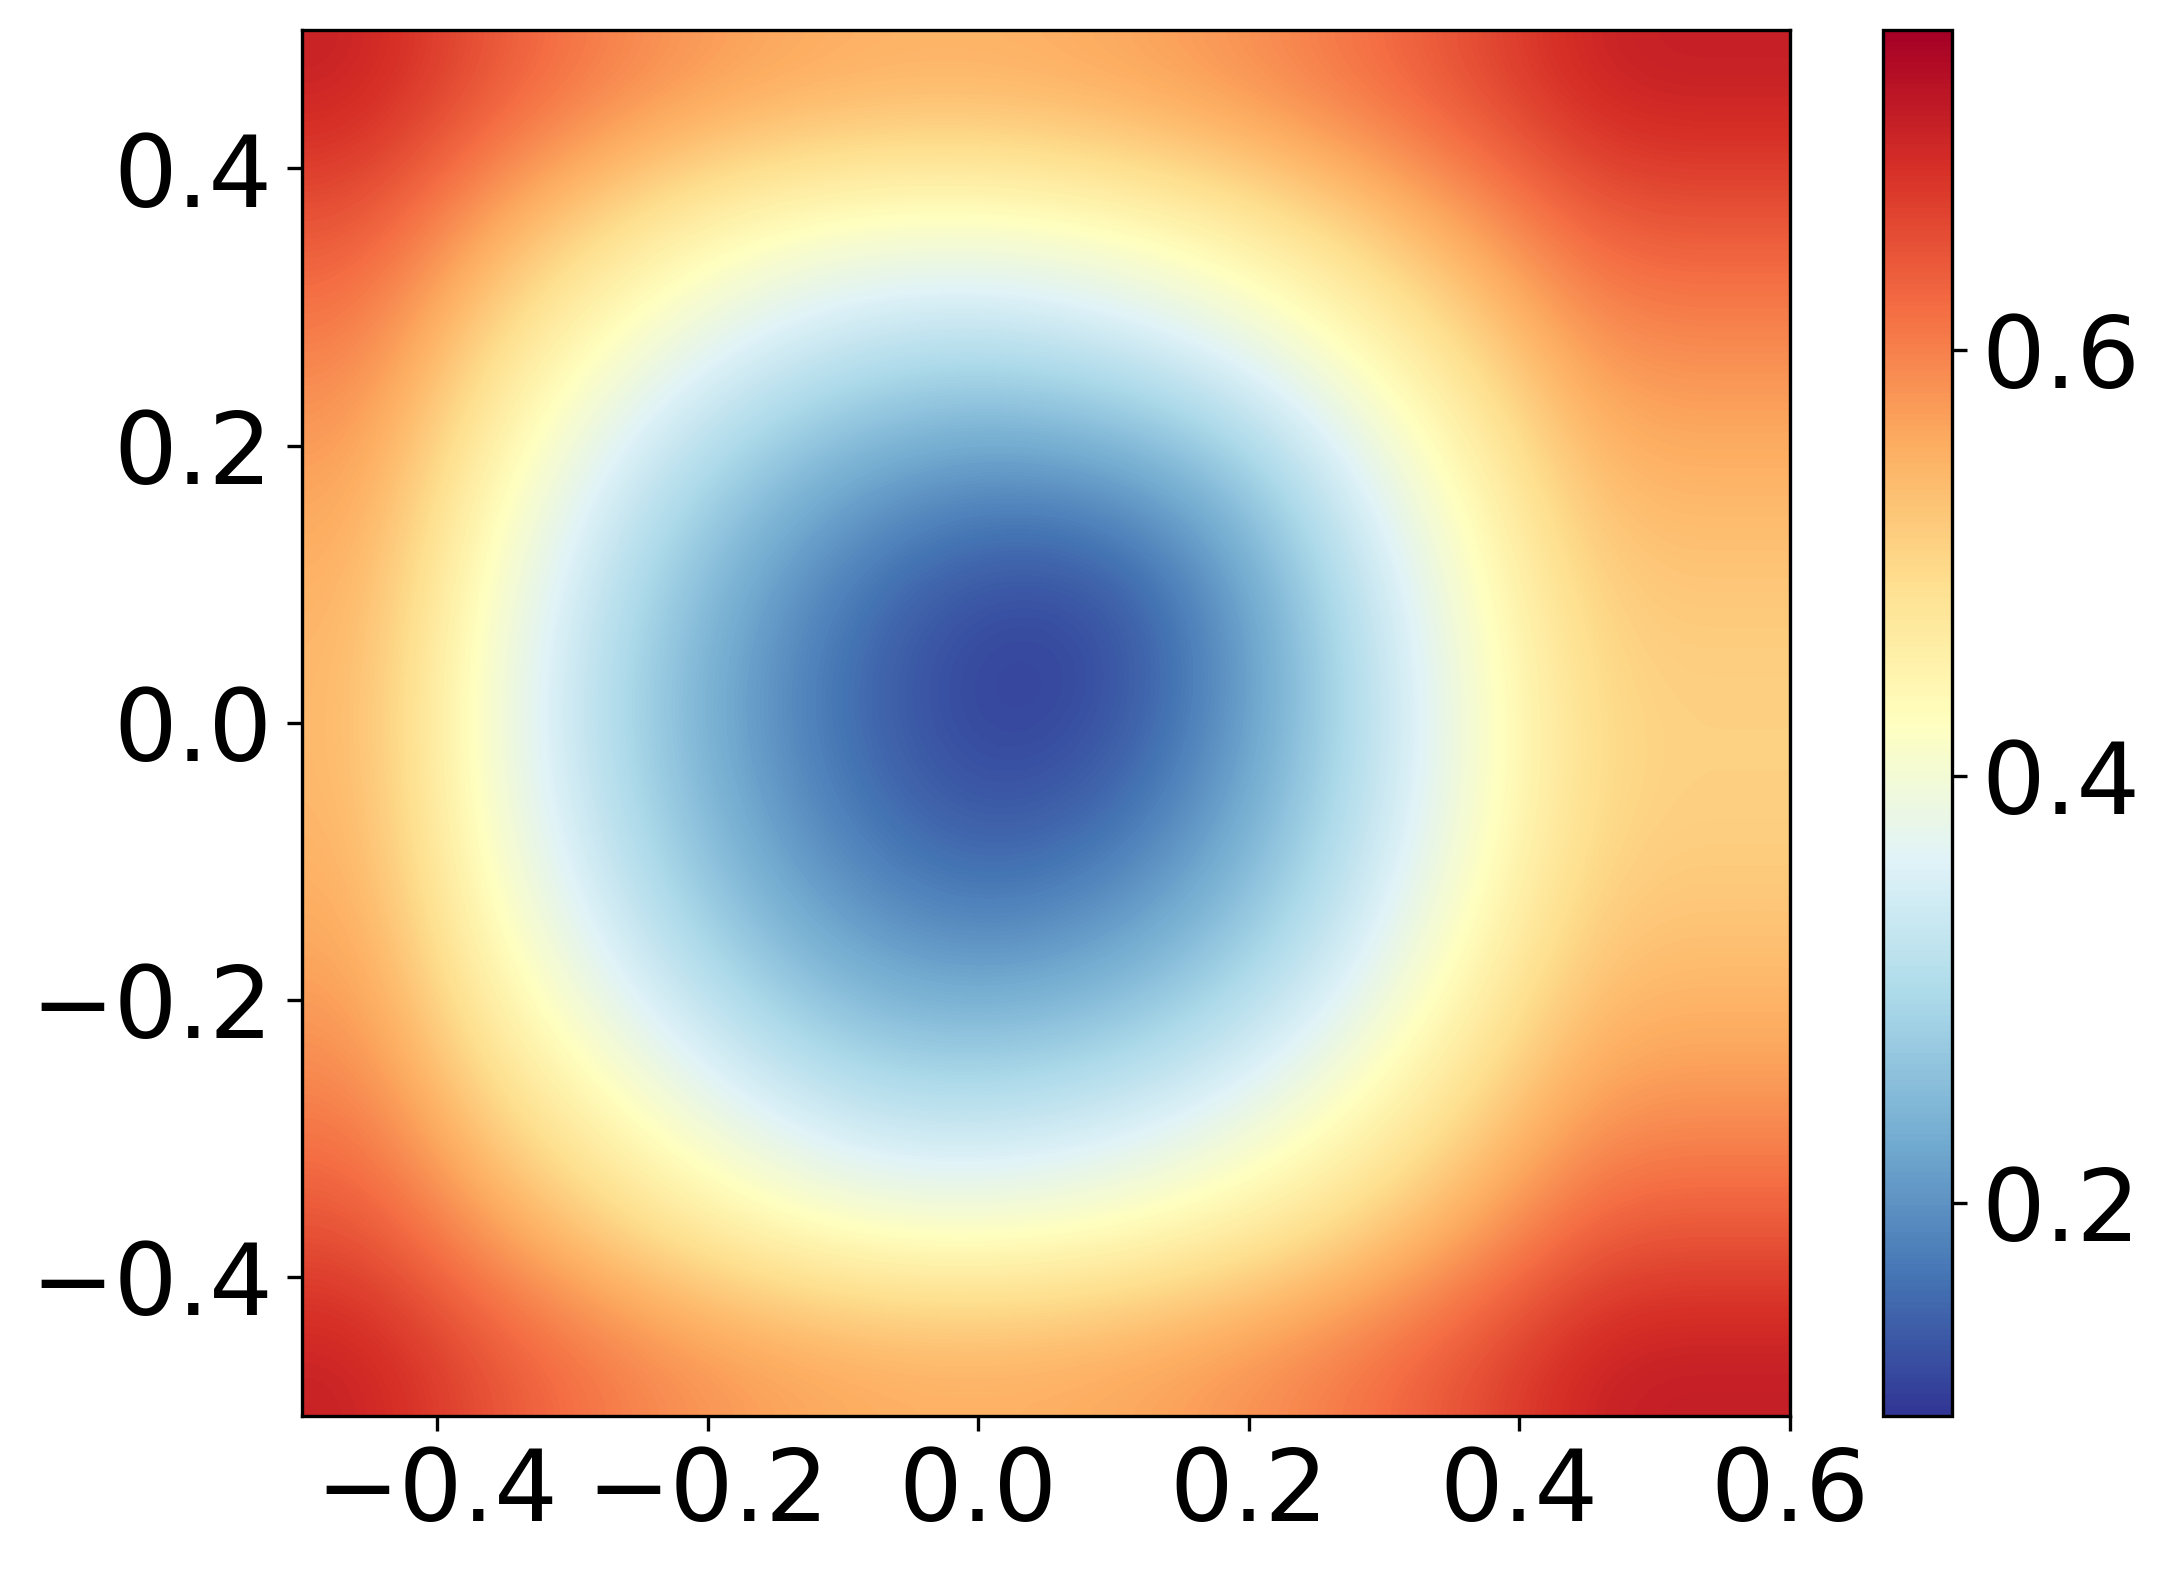
- The interpolant then constructs a piecewise cubic interpolating Bezier polynomial on each triangle using the Clough-Tocher scheme (scipy.interpolate.CloughTocher2DInterpolator). The interpolant is guaranteed to be continuously differentiable. The interpolant gradients are determined such that the interpolating surface curvature is approximately minimized.--> Figure 3
- Nearest-neighbor extrapolation is performed on the remaining points that can not be covered via Qhull. Note that mostly the boundary points beyond the x and y limits of input points can not be triangulated under Qhull. As long as those points are not far away from the available input points, the nearest-neighbor extrapolations to those points are accurate enough.--> Figure 4
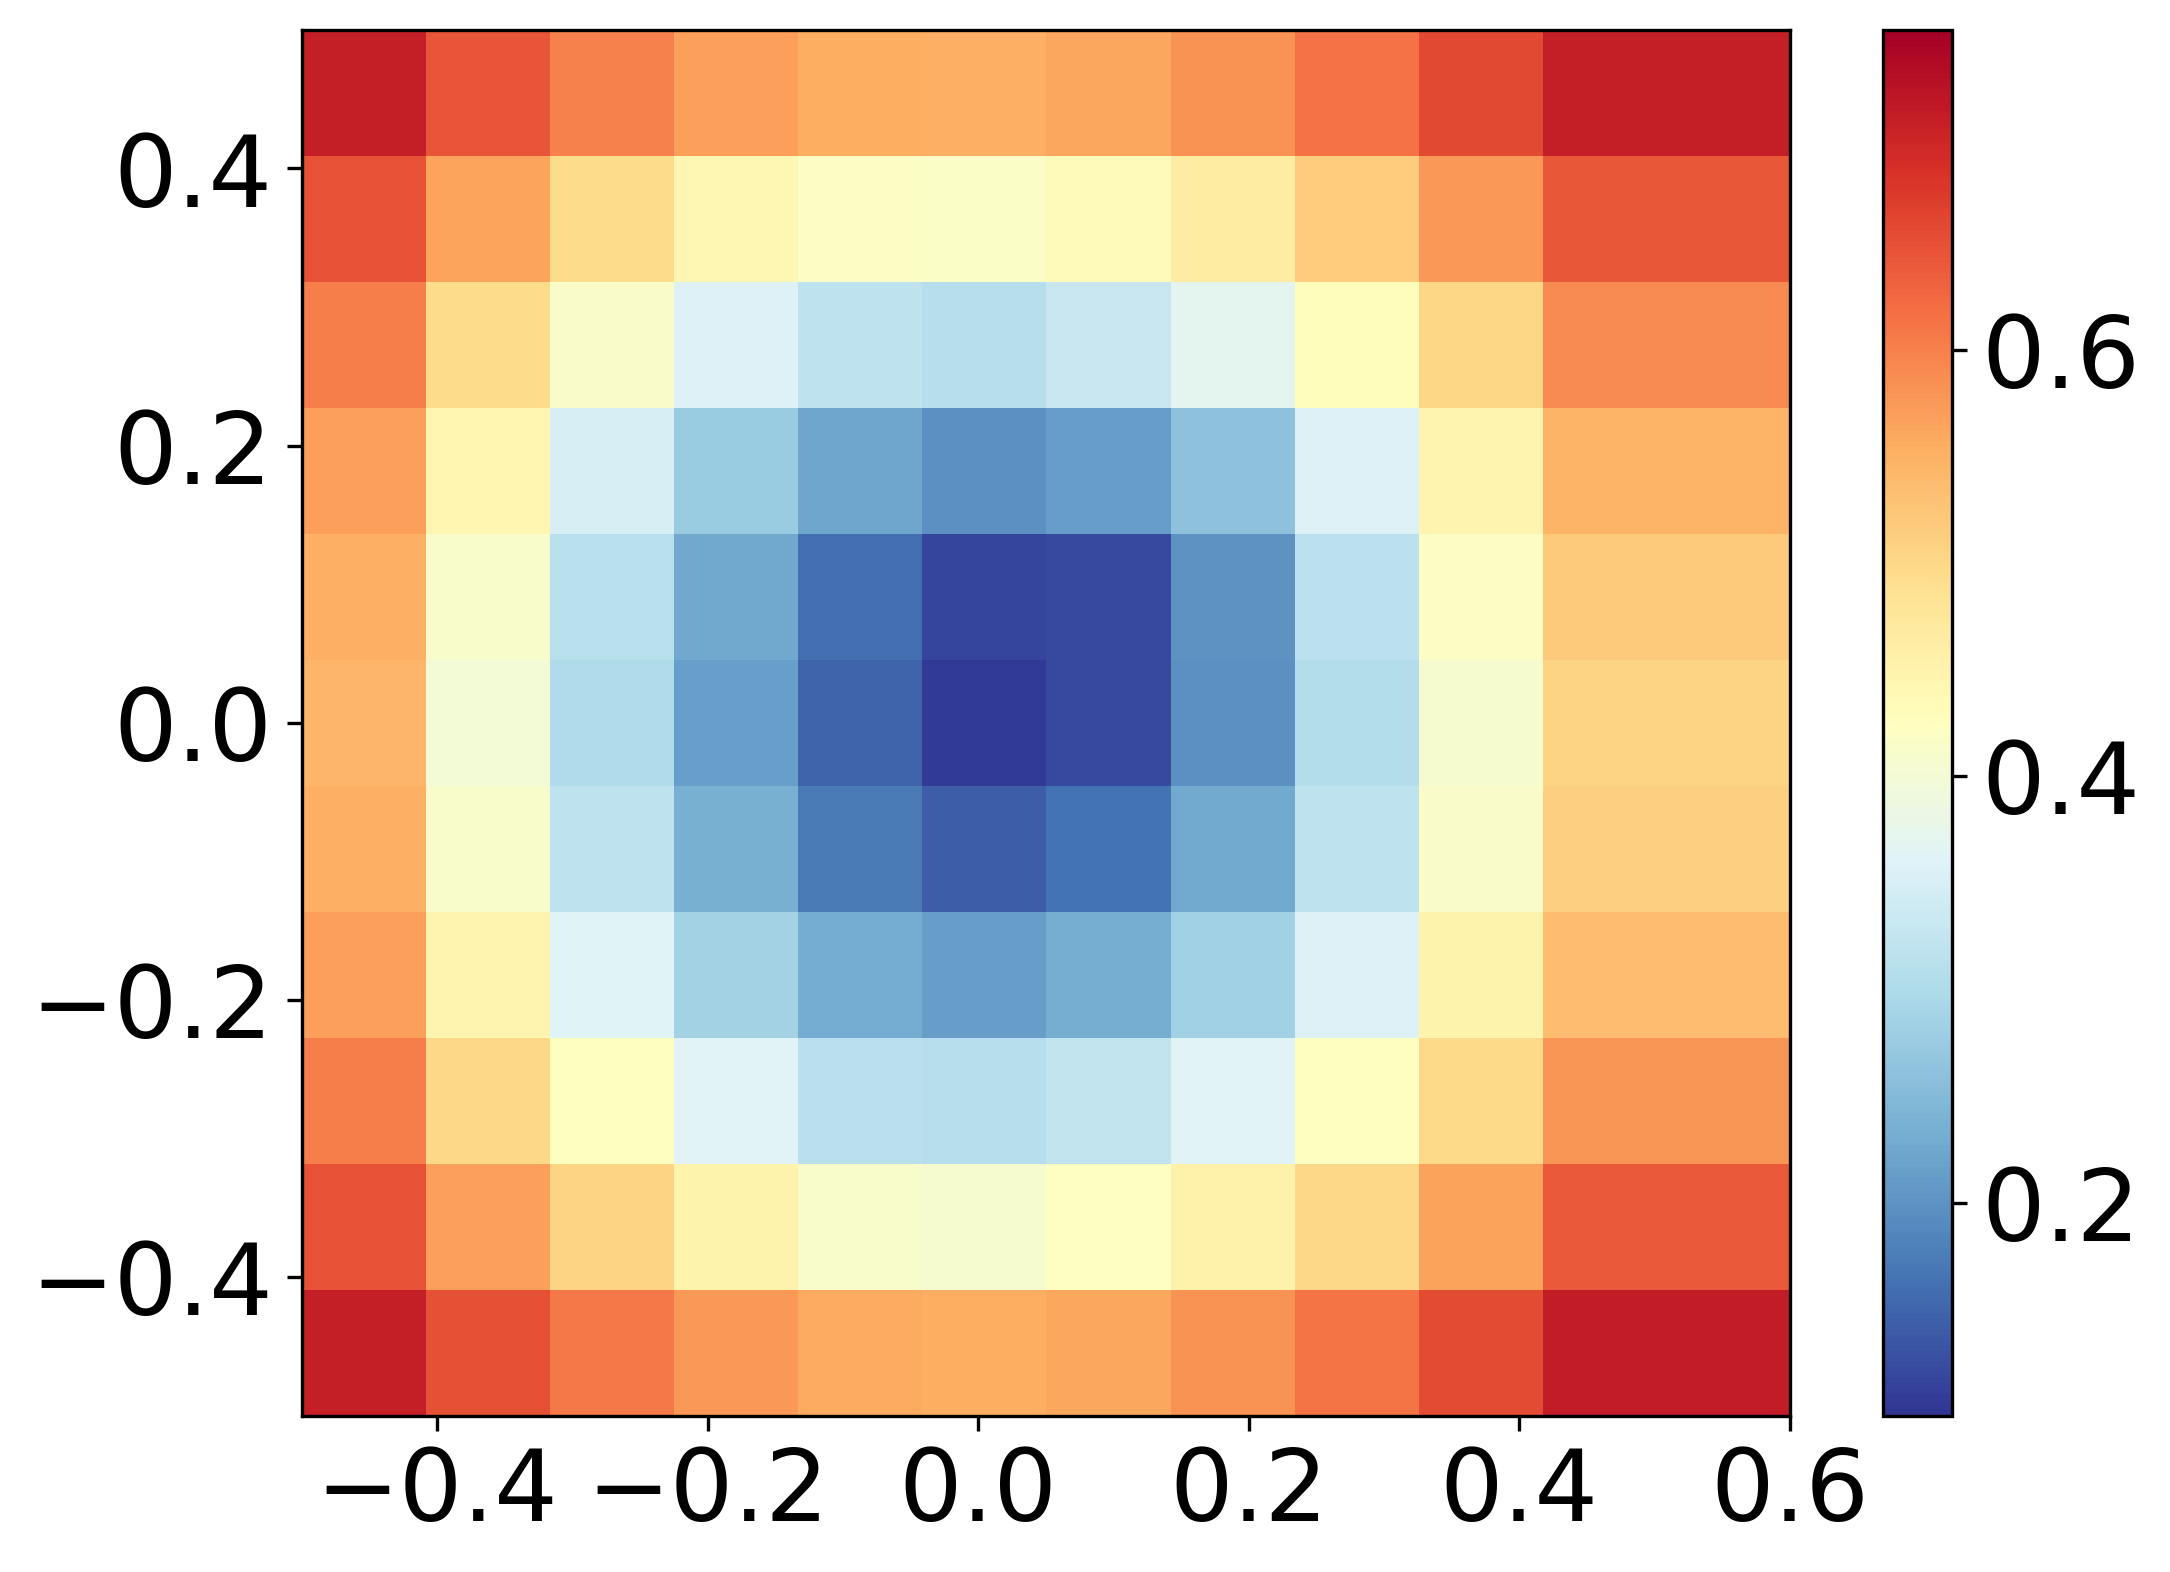
- Finally, bicubic interpolation, as implemented in python matplotlib.pyplot.imshow class is applied to smoothen the grid image.--> Figure 5
Note both the input data and interpolation grid are rescaled to unit square during interpolation to eliminate the effect of incommensurable units and/or large differences between the x and y scales.
Note, The nature of bandgaps, can solely be deduced from the enclosed regions by the direct-indirect transition lines and thus require no interpolation.